Electric vehicle (EV) sales keep growing fast: global new EV sales rose to about 17 million in 2024, an increase of roughly 25% year-on-year, and industry forecasts expect continued growth into 2025. China remains the dominant market (accounting for the majority of global EV sales — roughly 11 million units in 2024), while Europe and North America together supply most of the remainder. These shifts are reshaping which models and manufacturers lead sales worldwide.
The most common electric cars (models that sold the most worldwide)
Below are the EVs that consistently appear at the top of global and regional sales rankings in 2024–25, with short characteristics and available sales snapshots.
- Tesla Model Y — compact/mid-size electric SUV
- Why it sells: broad range of variants, extensive Supercharger network, strong global brand.
- Sales context: Model Y has been Tesla’s volume leader for several years and remained among the single best-selling BEV models globally in 2024 and into 2025 (Tesla sold about 1.79 million cars in 2024 across its range).
- Wuling Hongguang MINI EV — micro-EV (city car) from SAIC-GWM-GM JV (China)
- Why it sells: ultra-low price, tiny footprint for urban use, huge demand in China for affordable EVs.
- Sales snapshot: among China’s top sellers in 2024–H1 2025 with ~170k H1-2025 units in China alone (Q2/H1 tracker).
- BYD models (Dolphin / Seagull / Atto 3 / Yuan Plus, etc.) — mass-market hatchbacks & SUVs
- Why they sell: competitive pricing, broad model range, vertical integration (battery + EV manufacturing), strong China and growing export sales.
- BYD performance: BYD’s NEV sales climbed strongly in 2024; BYD reported multi-million cumulative NEV sales and rapid H1-2025 volume (BYD was closing the gap with Tesla in 2024).
- Tesla Model 3 — compact executive sedan (global volume seller)
- Why it sells: earlier mass-market Tesla model with strong acceptance worldwide; remains in top lists though volumes shifted with Model Y.
- Sales context: still among the top BEV models globally in many ranking tables for 2024–25.
- Xiaomi SU7 / Geely Panda / Geely/Skoda/Volkswagen models — rising Chinese and European models
- Why they sell: new entrants from China (Xiaomi EV) and expansion of European volume EVs (VW ID family, Skoda, Geely). H1-2025 lists show Xiaomi SU7 and Geely Panda among top sellers in China.
Note: many year-end and half-year lists differ by market and methodology. Visual, model-by-model trackers and quarterly manufacturer reports give the most precise model counts.
Typical characteristics of top EVs
- Range: entry city EVs (e.g., Wuling MINI) ~120–250 km WLTP/NEDC; mainstream SUVs/sedans (Model Y/3, BYD Atto 3) typically 350–600+ km depending on battery and trim.
- Price: extreme range from micro-EVs under US$6–8k (subsidised/China) to mainstream global SUVs US$30k–60k (after incentives), luxury EVs higher.
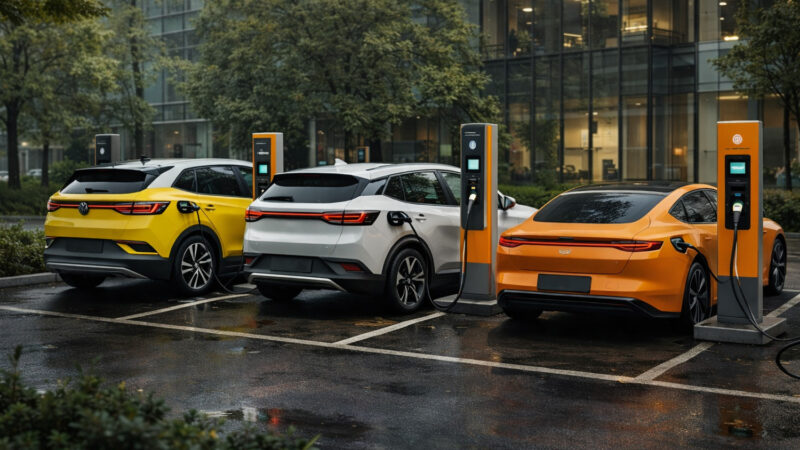
- Charging & tech: Tesla leads on charging network coverage; many Chinese manufacturers now support fast DC charging and advanced in-car software features. BYD’s vertical integration (battery, cells) helps lower costs and control supply.
Sales volumes and total share (high-level figures)
- Global new EV sales (2024): ~17 million BEVs + PHEVs (IEA/industry data). China accounted for ~11 million of those sales in 2024. Analysts expected 2025 sales to climb further (some forecasts in 2025 put 2025 at ~20–22 million).
- Leading brands by volume (2024): Tesla and BYD were the two largest BEV brands globally in 2024, with Tesla slightly ahead in total deliveries (Tesla ≈1.79M; BYD close behind with a strong 2024). The gap narrowed markedly in 2024 as BYD scaled.
- Market share by region (2024 snapshot): China (majority share), Europe (second largest by new registrations), North America (growing but smaller share relative to China/Europe). Together China + Europe + USA made up ~95% of EV sales in 2024.
Which countries and companies lead — and where they sell
China
- Leading companies: BYD, SAIC (incl. Wuling JV), Geely, XPeng, NIO (premium), Li Auto.
- Market footprint: overwhelmingly domestic sales in 2024 but rapid export growth into Southeast Asia, Latin America, Europe and Africa for select models. China accounted for the majority of global EV unit sales in 2024.
United States
- Leading companies: Tesla (dominant EV maker), plus increasing EV offerings from GM (Chevrolet Bolt/Blazer EV), Ford (F-150 Lightning, Mustang Mach-E), Rivian (niche), legacy OEMs ramping up.
- Market footprint: U.S. sales are concentrated domestically; EV penetration varies by state (higher in California & coastal states).
Europe
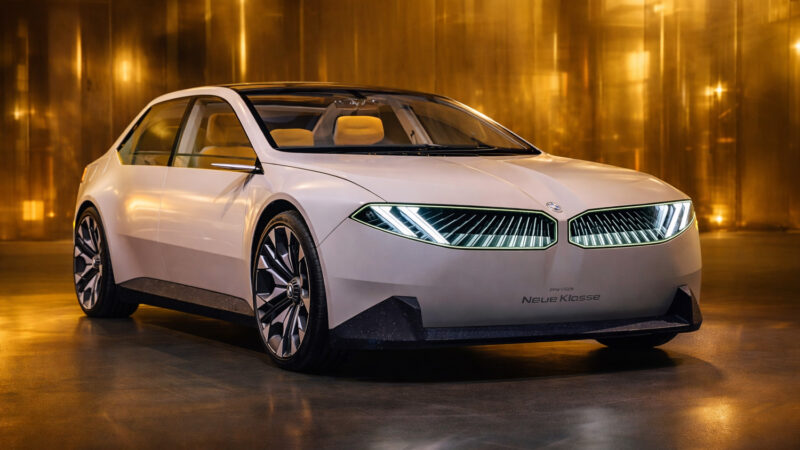
- Leading companies: Volkswagen Group (ID series, Skoda, Cupra), Renault, Hyundai/Kia (South Korean but major European sales), BMW, Volvo.
- Market footprint: Europe is a major BEV market with strong policy support, high EV adoption in Nordic countries, the Netherlands, Germany and the UK. VW overtook Tesla in early 2025 as Europe’s top EV brand in some measures.
Other regions
- Asia (outside China): South Korea (Hyundai/Kia), Japan (slower electrification but active), India (emerging EV market with two-wheelers and small EVs).
- Latin America & Africa: smaller volumes but growing import markets for Chinese EVs and used EVs; infrastructure and affordability remain limiting factors.
Financial share and value contribution
- EVs captured a rising share of global new-car sales (a rapidly growing slice of OEM revenue), but average transaction values vary: luxury EVs contribute disproportionately to revenue while micro-EVs generate volume but smaller revenue per vehicle. Analysts projected EVs to account for a significant and growing share of OEM revenue by the late 2020s as volumes increase and software/services monetise.
Trends shaping the leaders and the market
- Downward battery-cost pressure (but volatile input prices): battery price evolution remains central to EV affordability and OEM margins.
- Chinese scale & exports: China’s manufacturing scale is compressing global price points and enabling Chinese brands to expand abroad.
- Platform & software wars: OEMs compete on vehicle platform, in-car software, OTA updates and integrated services (charging, financing, subscriptions).
- Policy & incentives: national incentives, emissions rules and local policies (e.g., ICE bans) shape adoption speed and regional leaderboards.
Caveats on the data
- Methodology differences: country/brand/model tallies differ by source (manufacturer reports, registration data, independent aggregators).
- Rapid change: the market is evolving fast—model rankings and brand shares can shift quarter-to-quarter as new launches and price changes occur.